Our portfolio ownership structure is unique in that approximately half of our stores are wholly-owners, while the other half are either held in joint ventures or on behalf of third-party owners. This structure allows tremendous flexibility, and multiple avenues of growth in different situations and market environments. Our structure allows for capital light expansion or more significant investment through wholly-owned acquisitions. We have relationships with 239 partner groups of different sizes and in different locations. Our structure allows us to control concentration in different markets, increase our yields through joint ventures, and recognize significant economies of scale with reduced capital investment.
Rollover map for market information.
-
Northwest
29
2%
-
California
261
16%
-
Hawaii
16
1%
-
Mtn West
148
9%
-
Texas
173
10%
-
Midwest
201
12%
-
Southeast
196
12%
-
Northeast
288
15.9%
-
Mid-Atlantic
175
11%
-
Florida & P.R.
188
11%
- EXR PRESENCE
- NO PRESENCE
- Other – 36%
- Los Angeles – 12%
- New York / New Jersey – 12%
- Washington D.C. – 8%
- San Francisco – 8%
- Dallas – 5%
- Boston – 5%
- Atlanta – 5%
- Miami – 4%
- Chicago – 3%
- Houston – 2%
REDEVELOPMENT
We’re proud of our robust redevelopment program. This program enhances net operating income (NOI) at existing properties by increasing the net rentable square footage and optimizing unit mix. These redevelopments also come with the additional benefits of stores getting a fresh, on-brand facelift; turning older properties into modern, inviting space, that will be competitive in the market for years to come. Our continued investment and improvement of current properties enhances our visibility and brand recognition and is another way we are creating extra value through our portfolio.
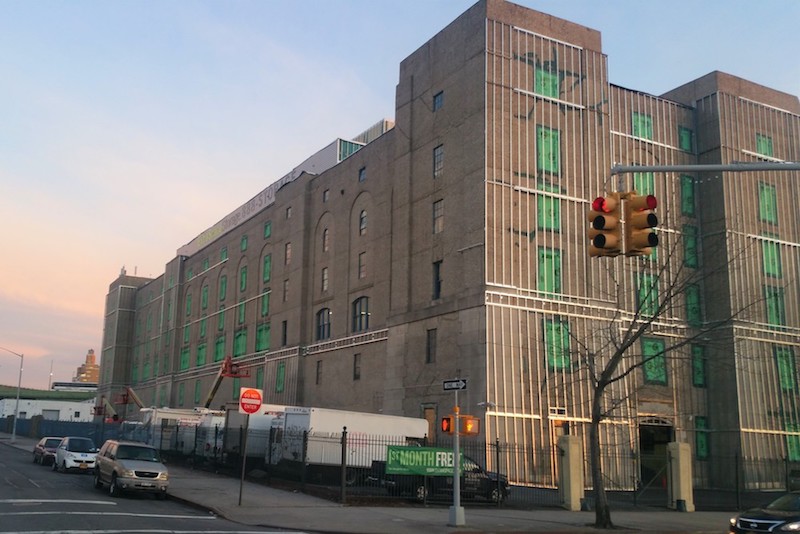
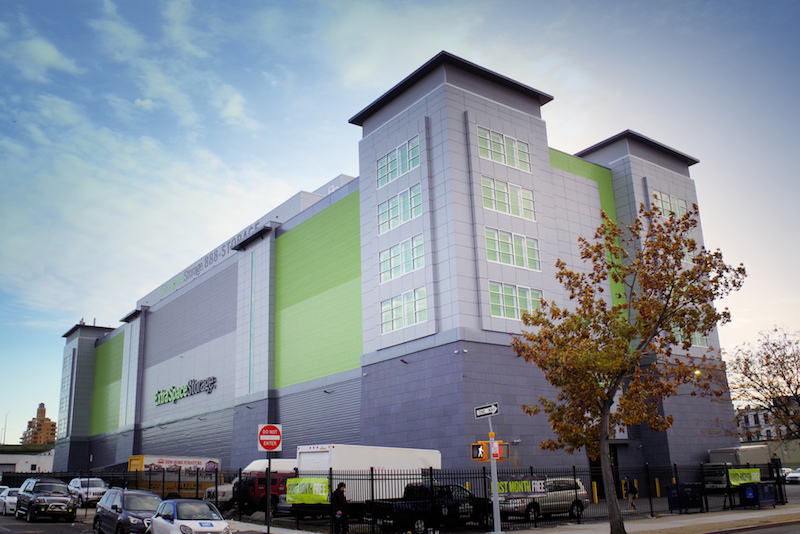
Brooklyn, NY